James D Munday, PhD

Infectious disease epidemiology and surveillance based in Basel
[ORCID] [Scholar] [bsky] [Mail]
Papers | Conferences | Posts
Using school-household networks to understand transmission dynamics
by jamesmunday
Background
School-aged children often play a significant and destinct role in epidemics. Historical contact surveys have revealed that up to 90% of child-to-child contact events occur in either school or home settings, demonstrating the key role og these contexts to transmission dynamics. We made use of this to construct a framework that uses routinely collected school census data to quantify the connectivity between schools and to understand how infections spread through school-age populations.
The Framework
We constructed a network of schools as linked through households. Each edge on the network is weighted by the number of unique contacts between schools that occur through shared households, for example: In household x, 2 children attend school A and 2 children attend school B, there are therefore 4 unique contacts between school A and school B. The sum of all households that form such a link gives the total number of unique contacts between schools A and B, we denote this as $C_{ij}$.

A network of schools linked by households A) A network of schools constructed such that schools are connected when contact is made between pupils of different schools within a household. B) The strength of contact between schools is quantified by calculating the number of unique contact pairs (one child in each school). The number of pairs per household is the product of the number of children who attend school a and the number of children who attend school b. The total number of unique pairs is the sum of unique pairs in each household with children attend both school a and b.
From this network we can estimate the probability of transmission between schools and simulate outbreaks on this network by sampling instances of ‘binary transmission networks’, where transmission between each pair of schools either occurs (edge weight of 1) of does not occur (edge weight 0). The network final outbreak size is calculated for an outbreak seeded by each school by finding the connected component of the binary transmission network.
Evaluating school closures/ Reopening
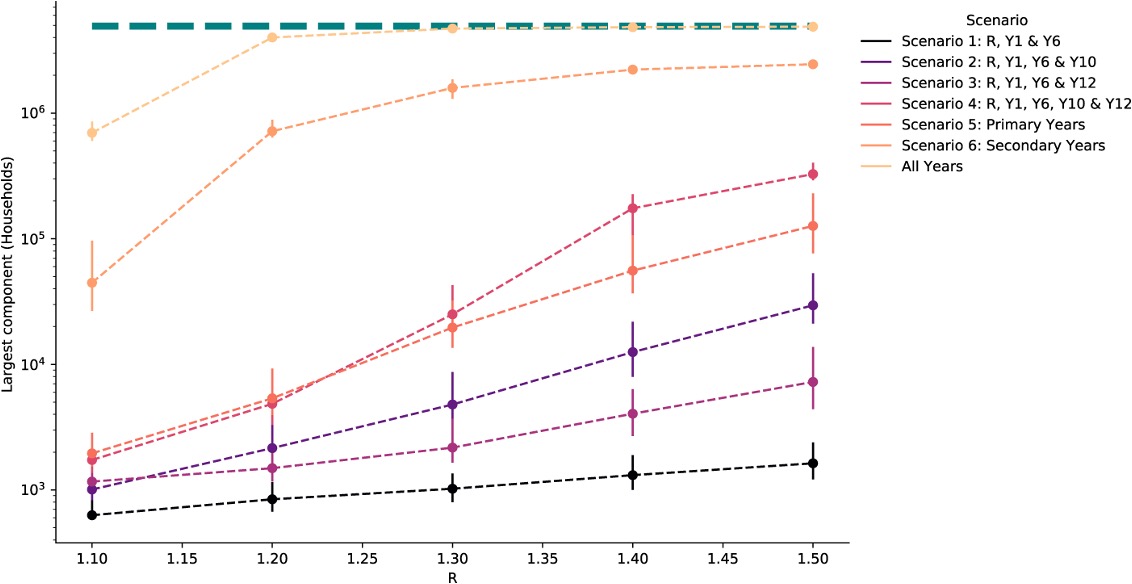
During the COVID-19 pandemic we used this framework to evaluate risk of reopening particular school years to the overall transmission risk across the network. This work revealed the relative importance of secondary school pupils in providing routes of transmission between schools. We found that reopening primary schools would likely have a limited impact on transmission beyond local outbreaks within schools, however reopening secondary schools was capable of providing long range chains of transmission which could stretch actross the country. See our paper in Nature Comminications.

The number of households with children attending a school in each largest connected component of the binary transmission networks (estimated potential outbreak cluster size) generated from transmission probability networks for school reopening scenarios. The points show the median and error bars show the 90% credible intervals for 1000 realisations of binary outbreak networks. The green dashed line shows the total number of households in the school system (4,927,163 households).
Measels in the Netherlands
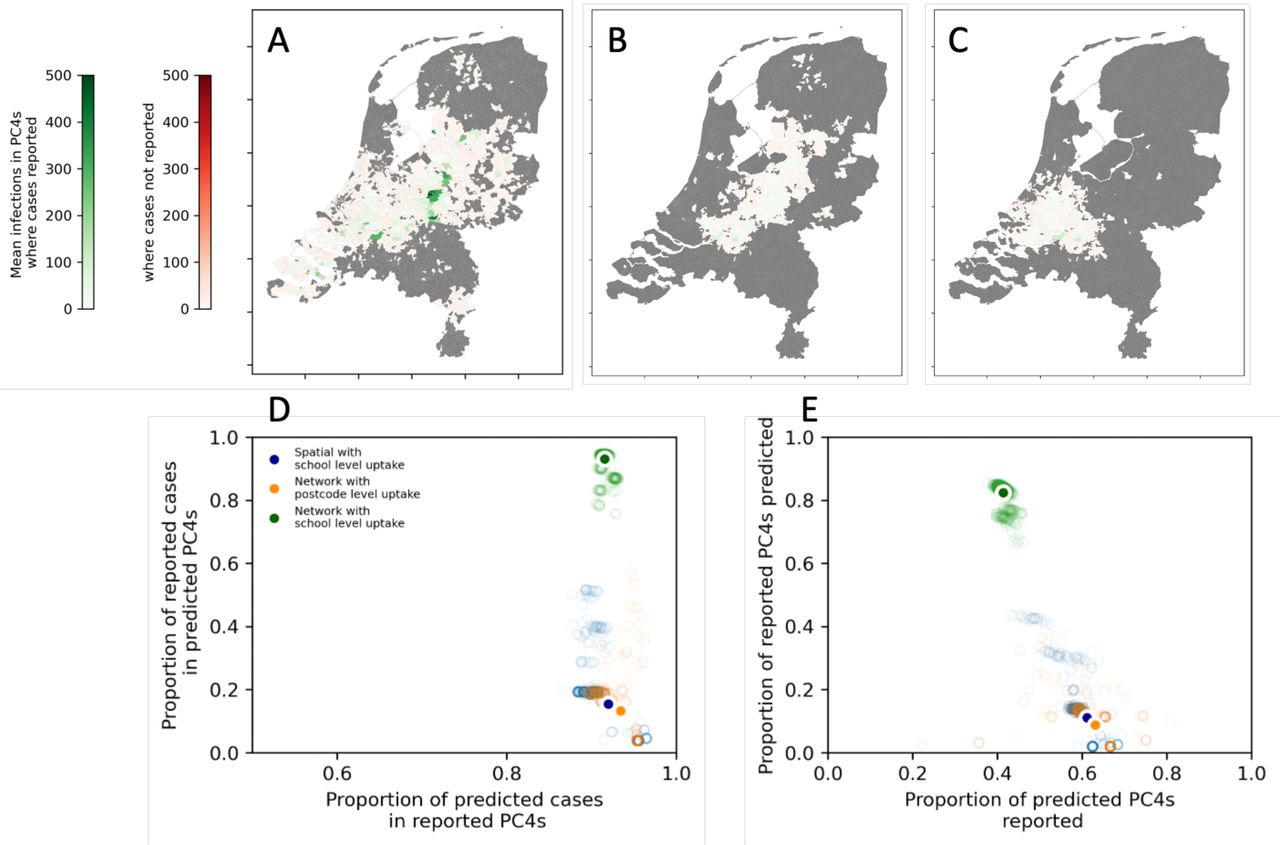
We also applied the method to study Measles in the Netherlands, where unvaccinated children cluster strongly within schools, particularly those with an affiliation to Anthroposophic and Orthodox Protestant communities. We showed that dispite very high uptake in the rest of the population, school and household contacts are sufficient to explain differences between the large outbreak observed in 2013/14 vs smaller outbreaks in previous years based on the school that the outbreak was initiated. See our paper in PLoS Medicine.

Mean number of cases across 1000 simulated in each PC4 region with a reporting rate of 10% (from estimates in literature). A) the baseline model: School data network with school level uptake., B) Alternative model 1: School data network with PC4 level uptake, C) Alternative model 2: Spatial network with school level uptake D) weighted sensitivity and specificity and E) unweighted sensitivity and specificity of the baseline and alternative network models.
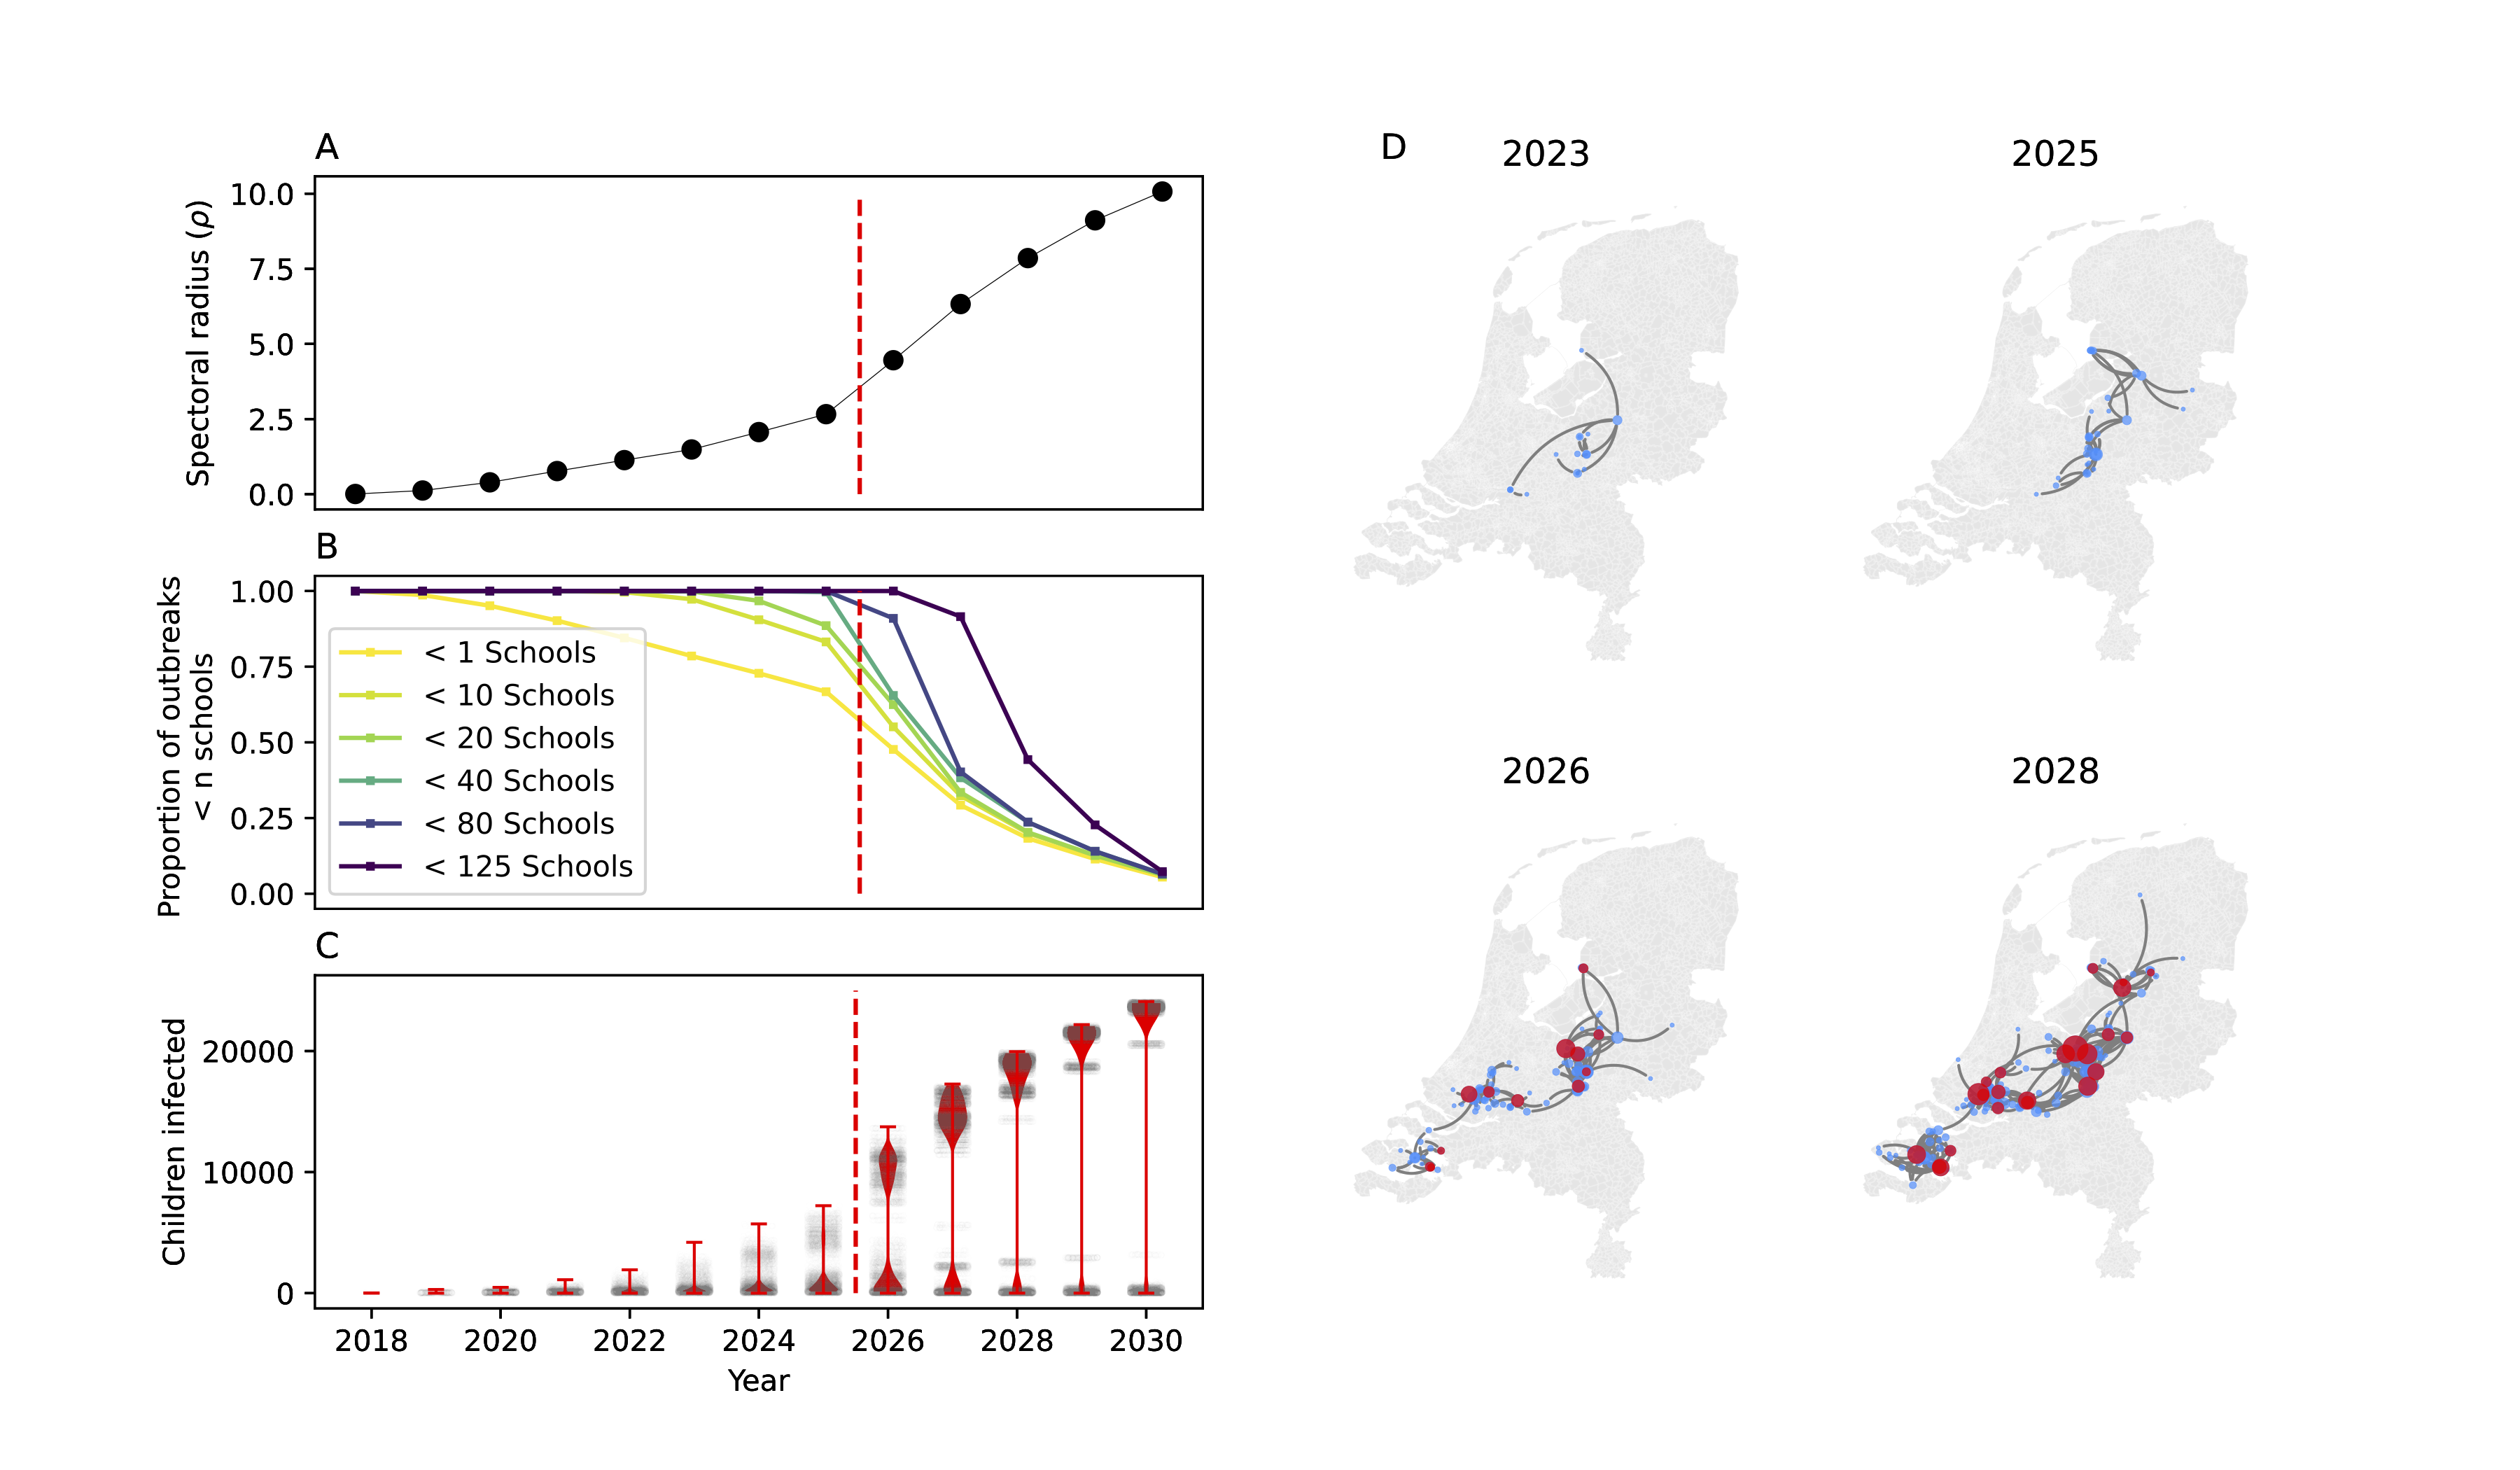
By projecting school immunity profiles we constructed transmission networks for the years follwing the major outbreak in 2013-14. We identified that the network sustains a sharp change in connectivity as children born since the previous outbreak transfer to secondary school. This is due to take place in 2025 and 2026, we anticipate that this could mean a substantial increase in the risk of large Measles outbreaks in the Netherlands. (Manuscript in preparation)

The evolution of measles outbreak risk on the school-household network in years since 2018. A) The spectral radius of the transmission probability network for each year. B) The proportion of outbreaks seeded in orthodox protestant schools that exceed final size thresholds of 1 to 125 schools. C) The distribution of the number of children infected in outbreaks simulated on the network, seeded in orthodox protestant schools. D) Graph visualisations showing examples of largest out-components (outbreaks) for individual edge percolation instances for years 2023 to 2028, blue vertices show primary schools, red vertices show secondary schools (geographically accurate).